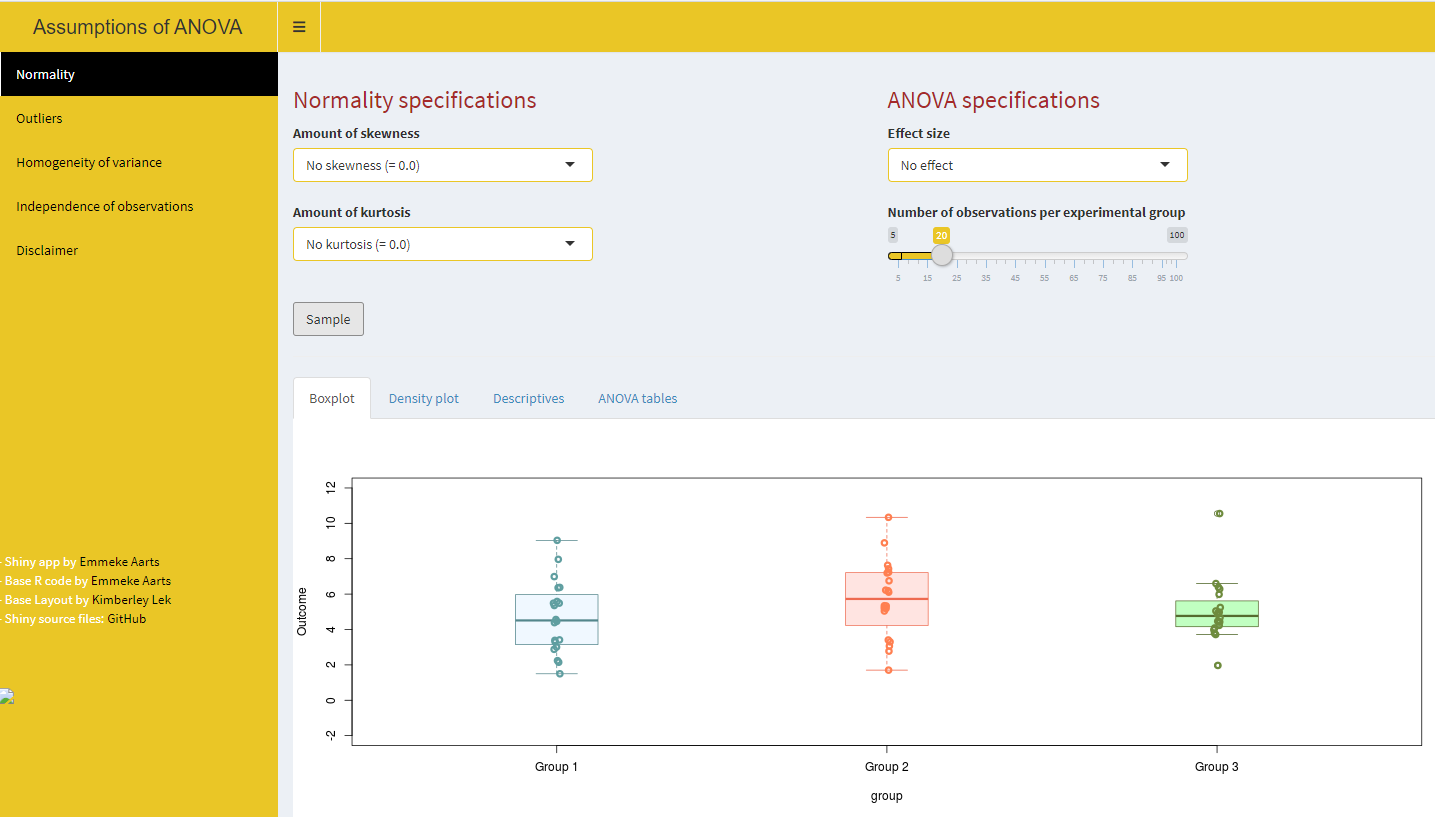
ANOVA-assumptions
A R shiny app to investigate the consequences of violating each of the assumptions of ANOVA Go to the app here.

Interactive visualization of ANCOVA
This app provides a fully interactive and draggable ANCOVA analysis, so that it is clear what moving points will do to the results of an ANCOVA. Go to the app here.
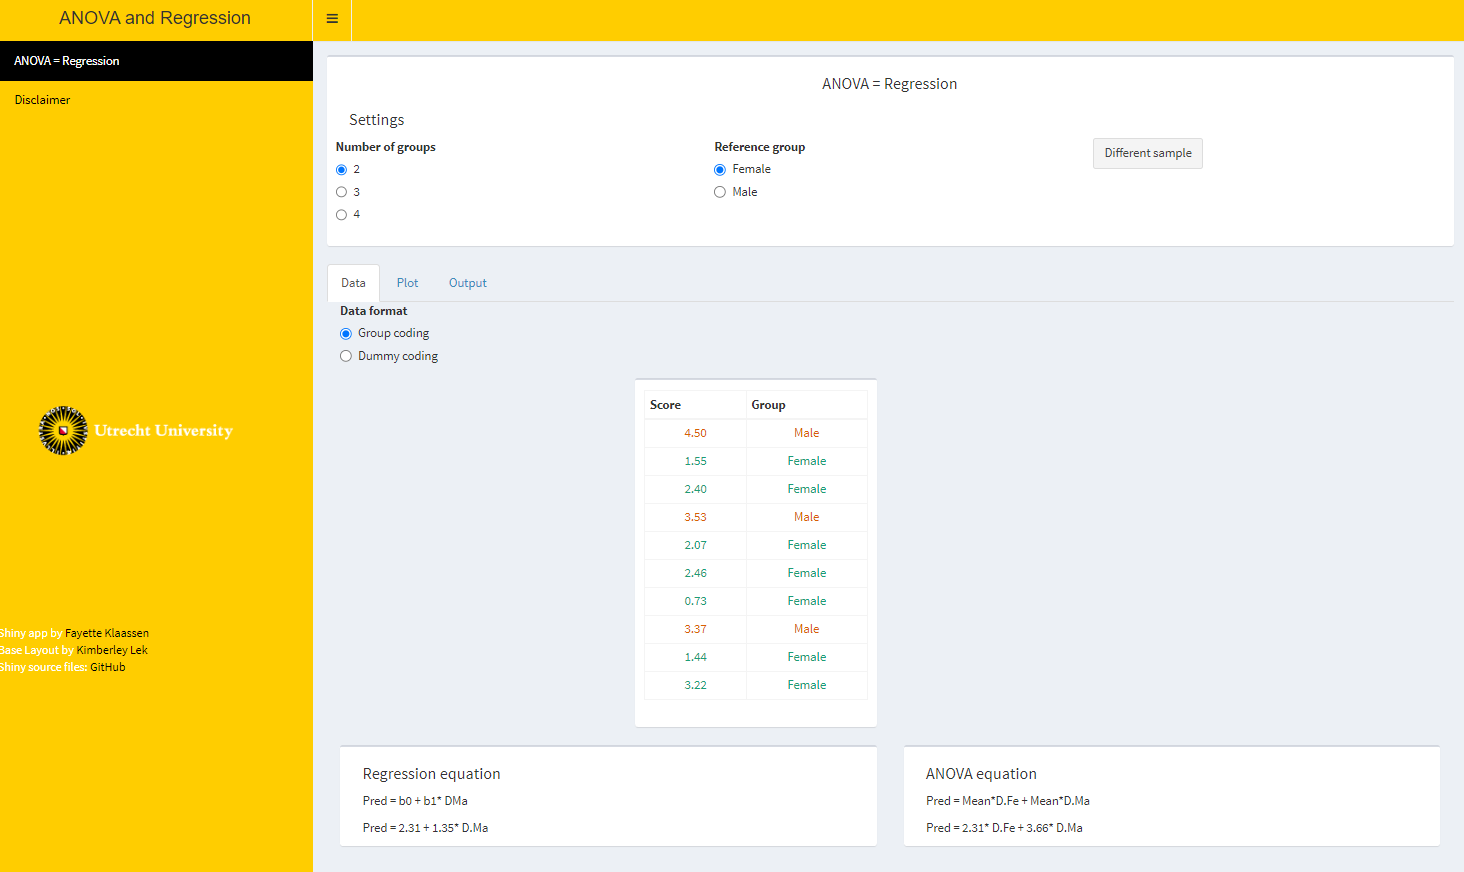
ANOVA is equal to Regression
This app explains that ANOVA is equal to regression if it is written differently. Go to the app here.
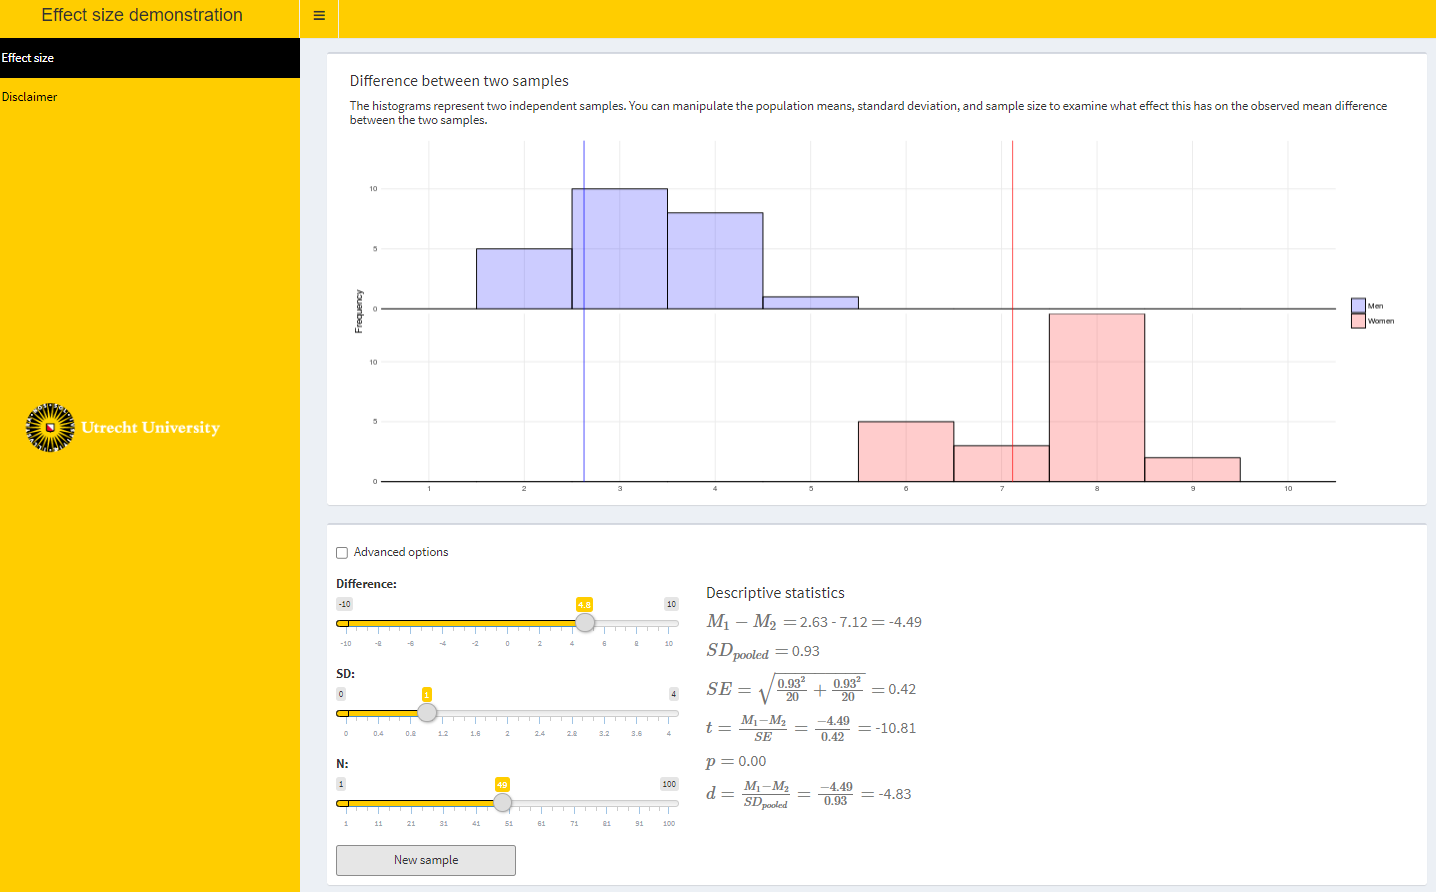
Understanding independent samples t-test
This app shows histograms representing two independent samples. You can manipulate the population means, standard deviation, and sample size to examine what effect this has on the observed mean difference between the two samples. Go to the app here.
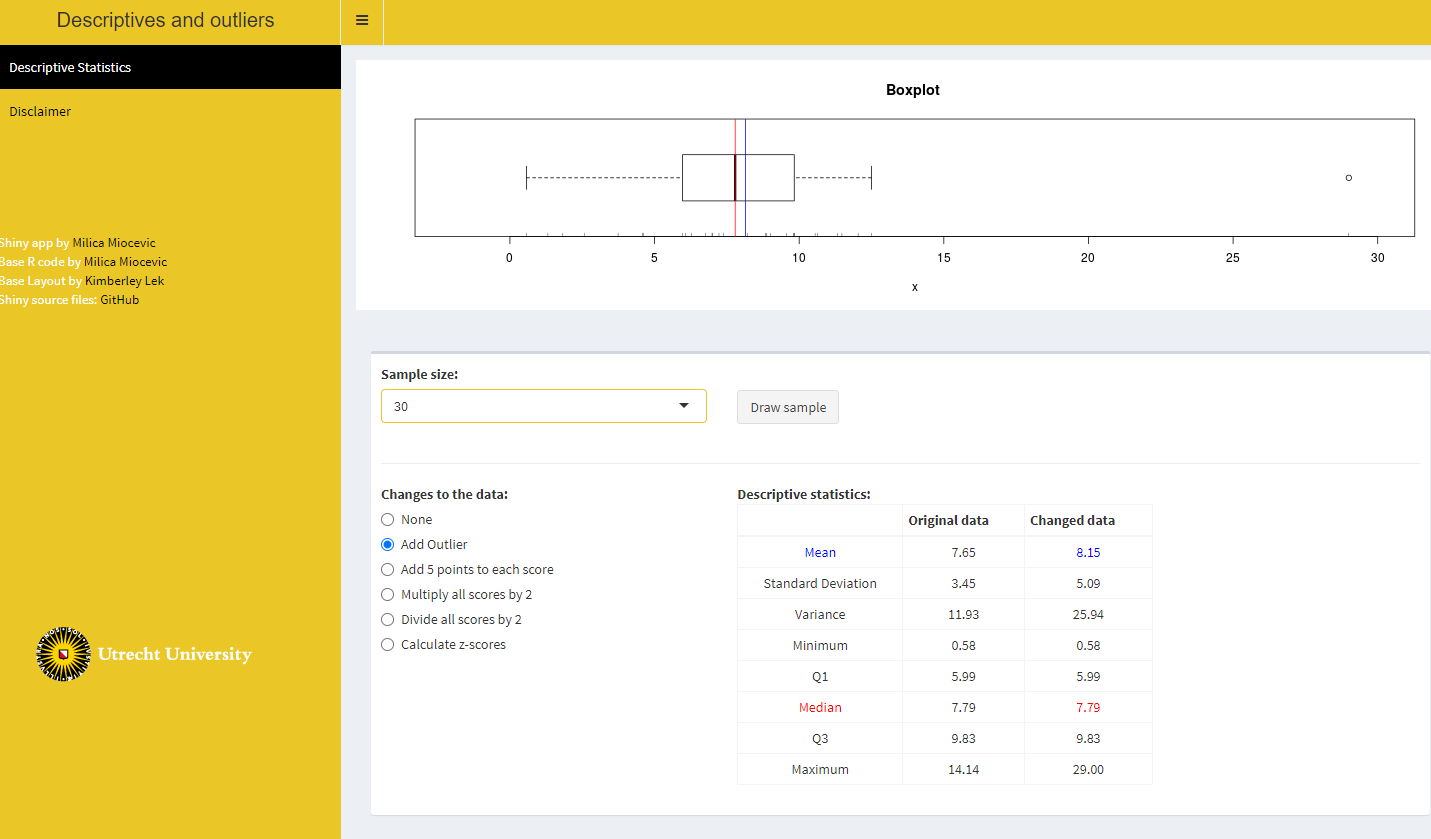
Descriptive statistics and outliers
This app allows you to play around with descriptive statistics and outliers. Go to the app here.
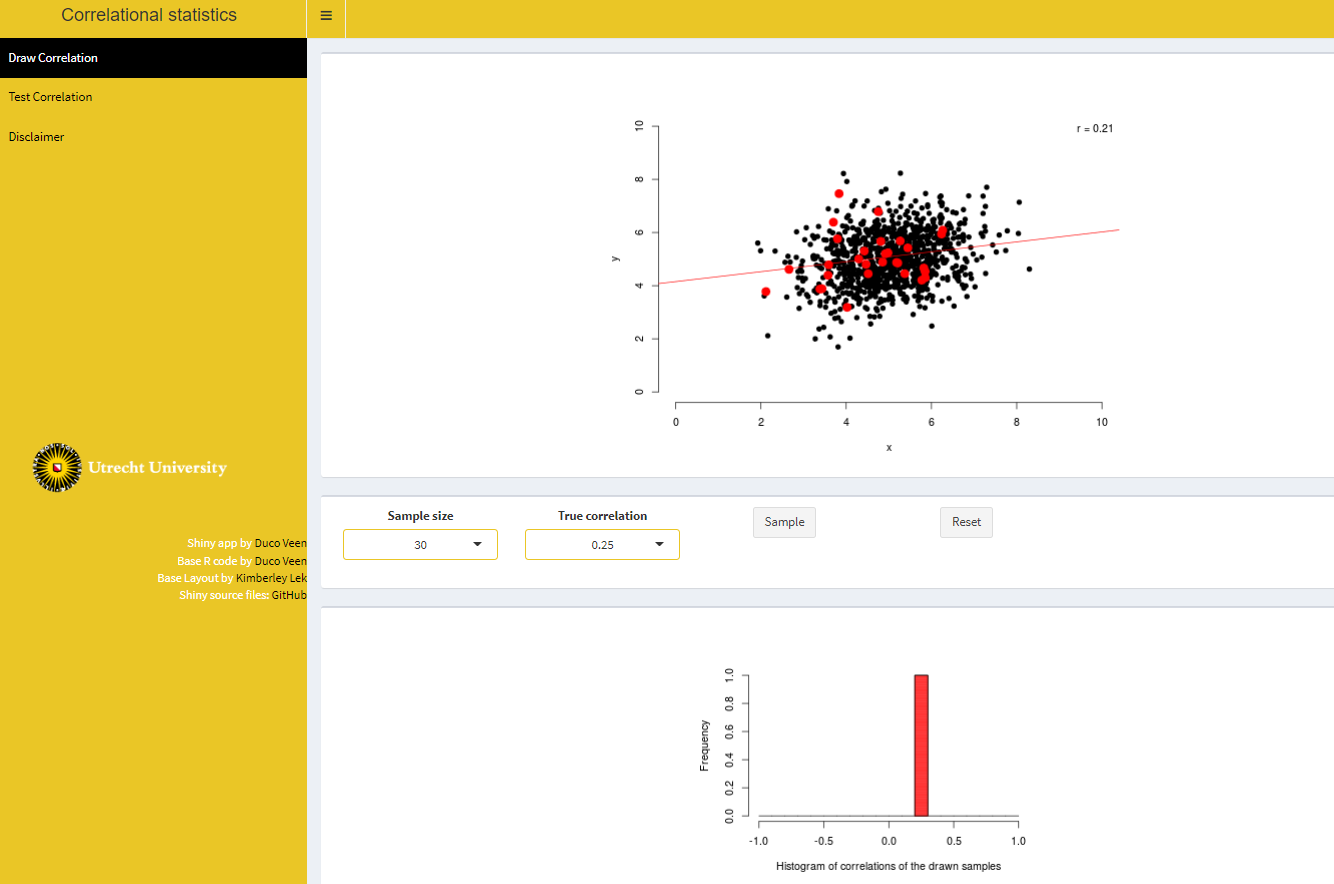
Sampling Correlations
This app illustrates how you can draw different samples from a population with a given correlation and how the sampling distribution looks when this is done multiple times. Go to the app here.

Correlation and Regression
Draw your own sample in the plot and get the associated correlation and regression. Go to the app here.
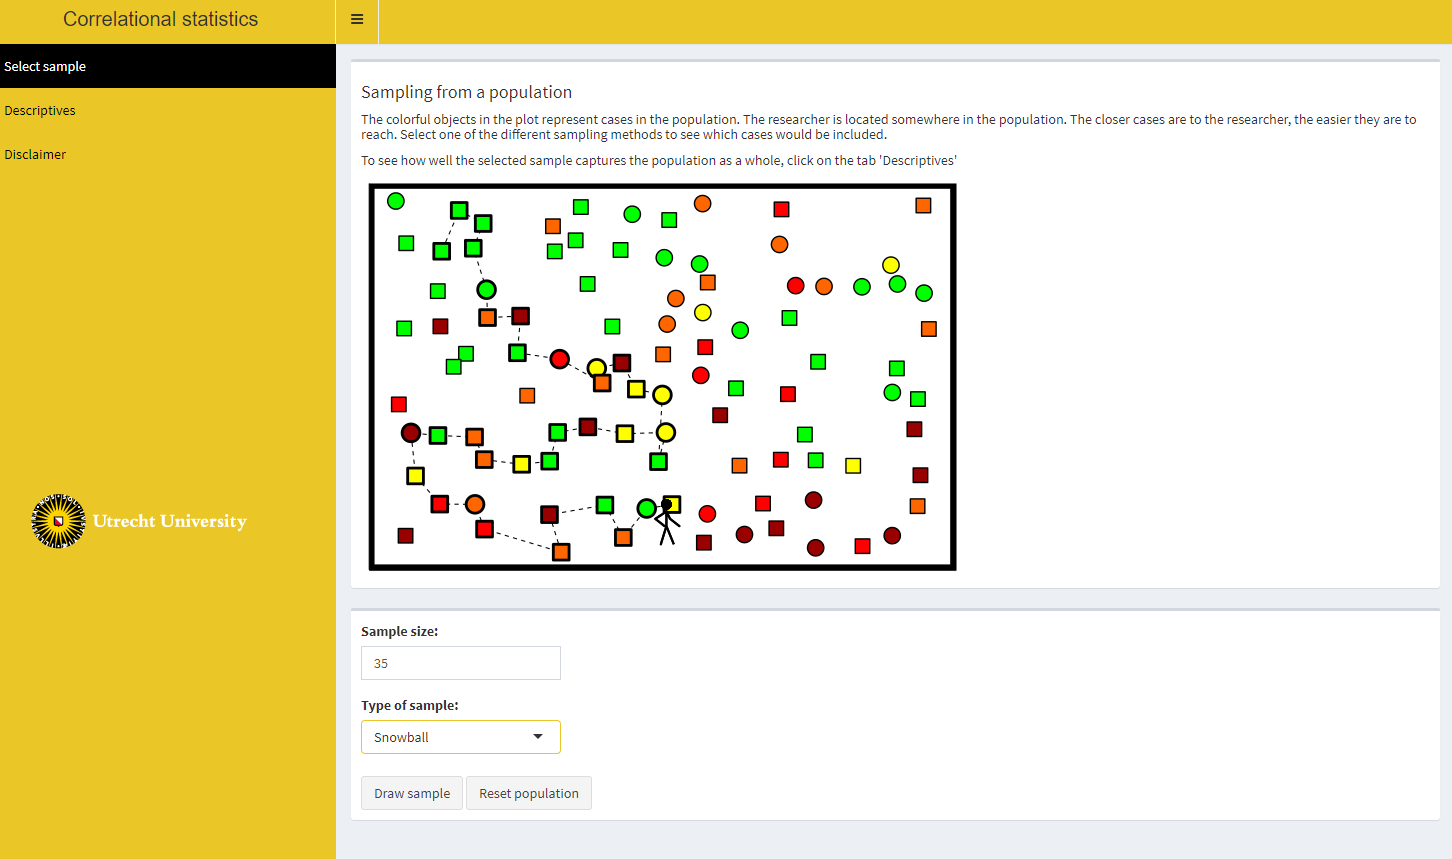
Sampling from a population
This app provides an illustration of different sampling techniques. Go to the app here.

Visualize Structural Equation Models
Visualize your structural equation model using lavaan syntax. Go to the app here.
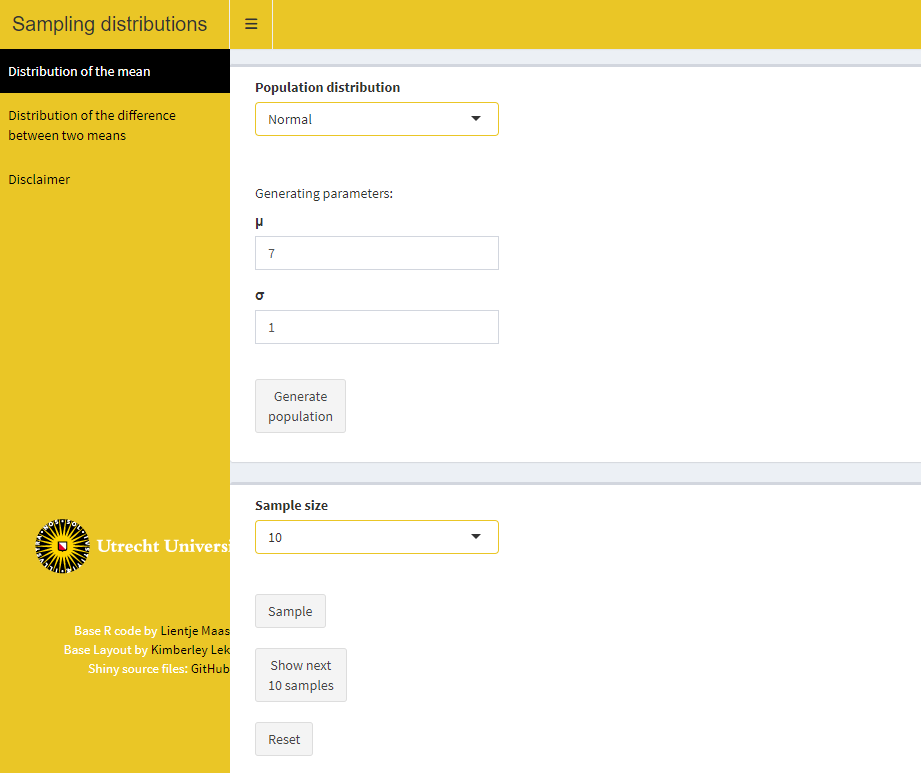
Sampling Means
Generate your population and sample from it. Go to the app here.