Understanding independent samples t-test
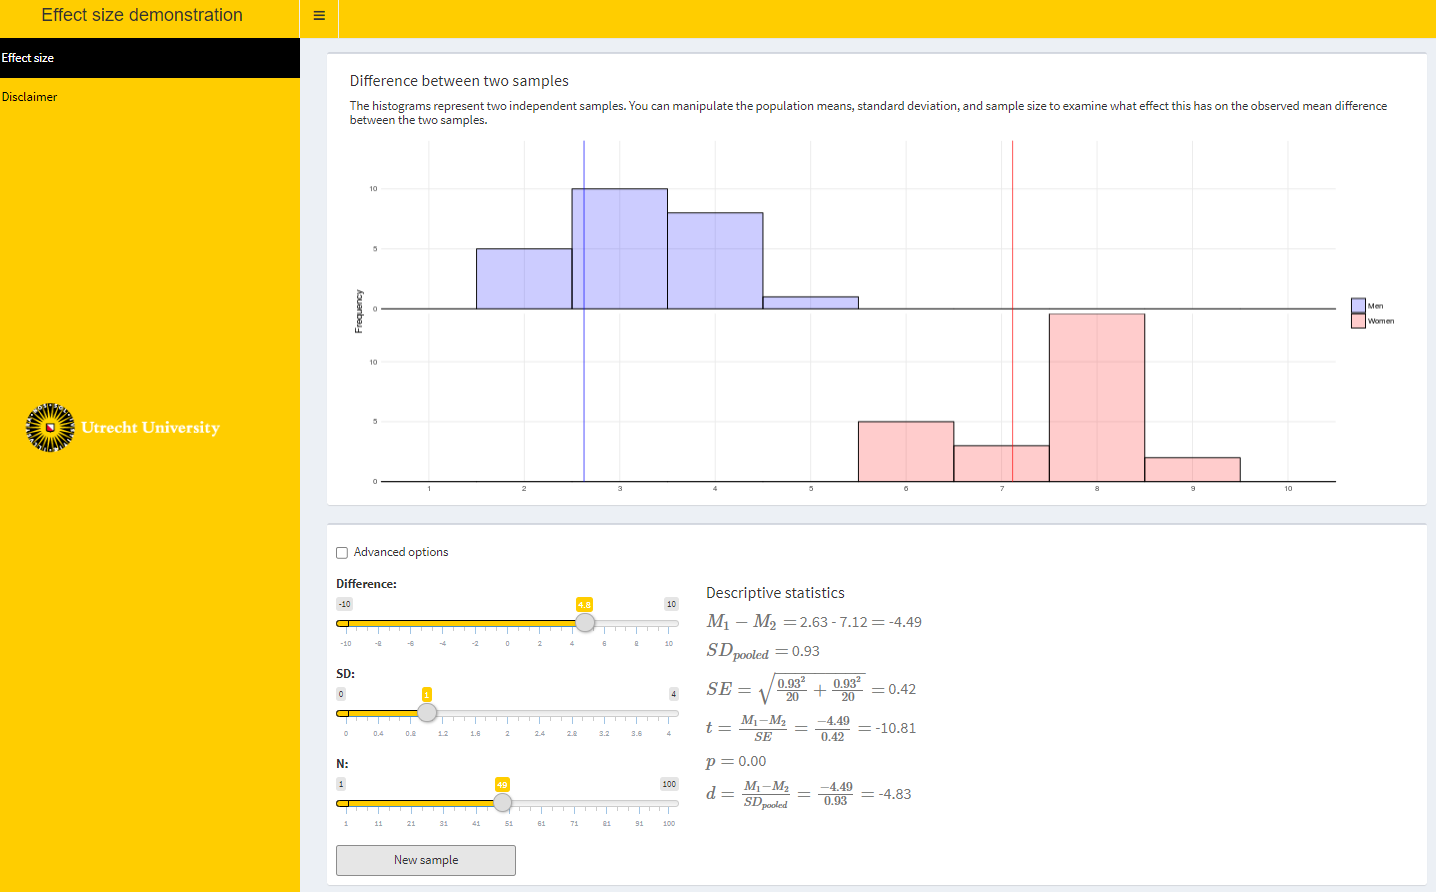
This app shows histograms representing two independent samples. You can manipulate the population means, standard deviation, and sample size to examine what effect this has on the observed mean difference between the two samples.
Go to the app here.