# load packages

library(qualtRics)

# authenticate with qualtrics (needs to be done only once)

qualtrics_api_credentials(api_key = "YOUR-QUALTRICS-API-KEY",
                          base_url = "YOUR-QUALTRICS-BASE-URL",
                          overwrite = TRUE,
                          install = TRUE)

# reload .Renviron file

readRenviron("~/.Renviron")Data Pipelining
What
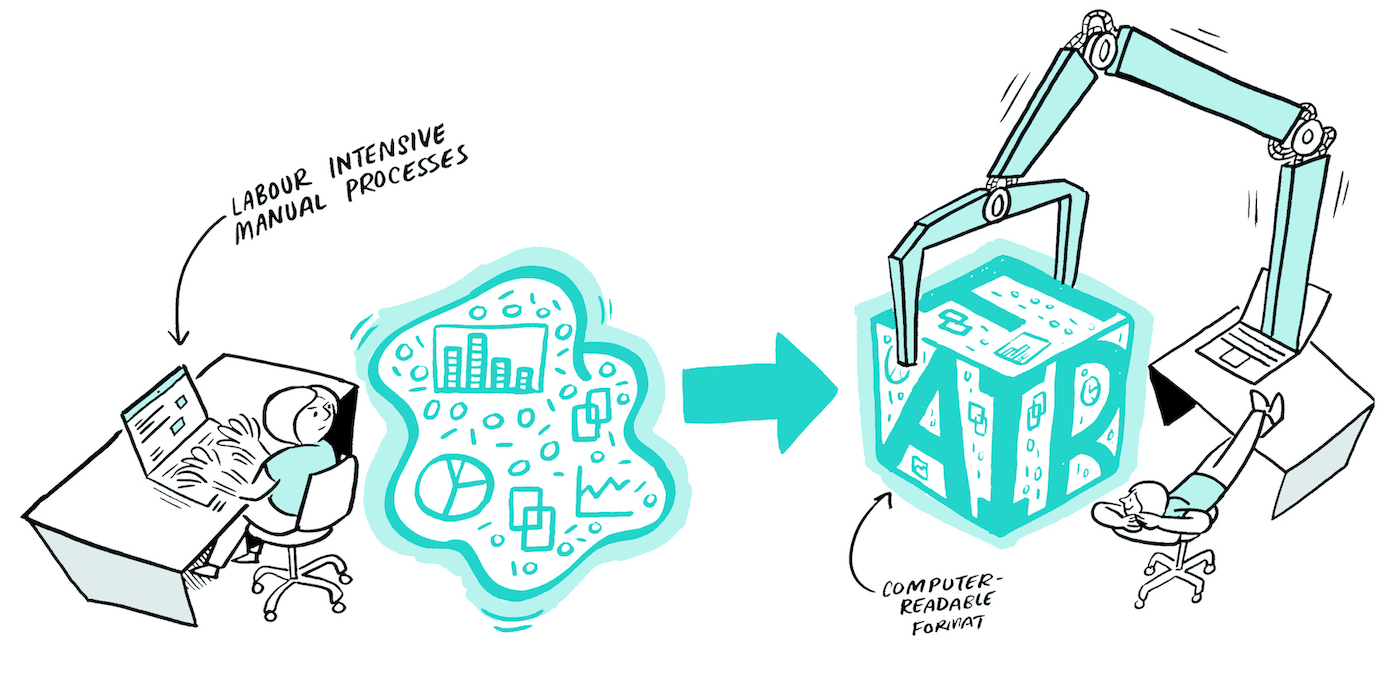
A data pipeline is a series of (automated) actions that ingest raw data from various sources and move it to a destination for storage and (eventual) analysis.
Why
The benefits of a data pipeline include:
- Time saved by automating the boring stuff!
- Reduced errors/mistakes.
- Tasks broken down into smaller steps.
- Reproducibility!
Who
This is relevant for researcher(s) working directly with the data for processing and/or analysis.
When
Here’s a rule of thumb, just as an example:
If you have a task that needs to occur >= 3 times, consider automating it. If automation isn’t possible, think about how you can make the task as efficient as possible.
Ideally, you would pilot your data pipeline before data collection begins. However, improvements can be added at any stage if they don’t disrupt the workflow. The added advantage of putting in the effort upfront is that the pipeline will likely be reusable for other projects.
Where
Your data pipeline will consist of scripts that live in the storage location used during the active stage of your project. They can be separate from analysis scripts for publications, but this is optional — choose what works best for your workflow.
Consider placing your scripts under version control using Git and making use of the university’s GitHub organization for collaboration.
How
Once you have drawn your data flow diagram (DFD), inspect it to identify opportunities for automating tasks using the rule of thumb above, then explore and implement appropriate solutions.
Extracting Data
- APIs: Many data collection tools provide APIs. For example, Qualtrics can be accessed via the
qualtRicsR package or theQualtricsAPIPython library to automate survey exports. - Browser Automation: If APIs are unavailable, R (
RSelenium) or Python (Selenium) can automate browser actions, such as logging in and downloading files. Note: Two-factor authentication may limit feasibility. - Automatic Transcription: Amberscript can automatically transcribe interviews and save them directly to YODA.
- YODA Integration: The
ibridgestool andpython-irodsclientallow you to fetch data from YODA. They can also be used to deposit data into YODA.
Processing Data
You can use R/Python scripts to automate (pre)processing of data: dropping or renaming columns, (re)applying variable and value labels, recoding variables, computing summary scores, handling duplicates, managing missing data.
Automating & Scheduling Scripts
If your scripts are fully reproducible and do not require manual input:
- You can run individual scripts from the command line or create a batch/shell script to run multiple scripts sequentially.
- To take it a step further, these scripts—or the batch/shell script—can be scheduled to run at a specific time or on a recurring basis using Windows Task Scheduler,
cron, or R packages such astaskscheduleRorcronR.
Bonus
You can also send emails with R & Python! For example, if you’ve ever needed to contact participants due to low response rates or incomplete surveys, you can implement these checks with a script. Based on the results, a follow-up script can automatically draft and send emails (from a template) to participants flagged for a check-in.
The Microsoft365R package allows you to send emails from Outlook, while the blastula package helps you compose emails to appear more presentable. Note: You can use your own email address when testing the packages, but for research projects, it is recommended to link them to a project-specific email address rather than your personal one.
Tools
Tip
The following tools are roughly presented to provide an idea of what they look like. You can reach out to RDM Support for hands-on assistance in setting up your data pipeline!
QualtRics R package
See: https://docs.ropensci.org/qualtRics/
# load packages

library(qualtRics)
library(here)
library(readr)

# fetch data

data <- fetch_survey(surveyID = <SURVEY-ID>, label = FALSE, convert = FALSE, add_var_labels = TRUE, verbose = TRUE)

# save data

write_csv(data, here(paste0("data/raw/", Sys.Date(), "_data.csv")))
iBridges
The example below is for use within R scripts on a Windows workspace. Please refer to the iBridges documentation for more information and different implementations.
# upload data

system('ibridges upload "~/data/raw/2025-12-25_data.csv" irods:/nluu12p/home/my-research-project/data/raw')

# download data

system('ibridges download irods:/nluu12p/home/my-research-project/data/raw/2025-12-25_data.csv "~/data/raw"')
Windows Task Scheduler
Refer to the following website on how to get started with Windows Task Scheduler (follow along with screenshots): https://www.getclockwise.com/blog/automated-task-windows-task-scheduler
One MacOS & Linux, you can run cron jobs from the command line.
taskscheduleR package
See: https://github.com/bnosac/taskscheduleR
The taskscheduleR packages interfaces with Windows Task Scheduler from within R. If you’re using MacOS & Linux, you can use the cronR package instead.
library(taskscheduleR)

scheduled_script <- "path/to/folder/myscript.R"

## run script once within 120 seconds

taskscheduler_create(taskname = "extract-data-once", rscript = scheduled_script,
                     schedule = "ONCE", starttime = format(Sys.time() + 120, "%H:%M"))

## Run every 5 minutes, starting from 10:40

taskscheduler_create(taskname = "extract-data-5min", rscript = scheduled_script,
                     schedule = "MINUTE", starttime = "10:40", modifier = 5)

## delete tasks

taskscheduler_delete("extract-data-once")
Windows Batch File
title batch script for automate-the-boring-things

set startTime=%time%

cd %USERPROFILE%\Documents\Programming\automate-the-boring-things

Rscript "scripts/01-qualtrics-download.R"
Rscript "scripts/02-preprocessing.R"
Rscript "scripts/03-yoda-upload.R"

echo Start Time: %startTime%
echo Finish Time: %time%

pause