import pandas as pd

infile = "../Data/etmgeg_260.txt"

# to get the very last data, we can also directly link python to the online source
infile = "https://cdn.knmi.nl/knmi/map/page/klimatologie/gegevens/daggegevens/etmgeg_260.zip"

rawdata = pd.read_csv(infile, skiprows=51, skipinitialspace=True)Load and tidy data
Loading and Tidying data
In the first weeks we worked with csv files that were directly readable and ready for analysis. However, in the real world we find data in many formats, layouts, file types etc. Luckily Python can read and process most of of them with default functions that make working with common dataset reasonably easy. (Plus you can also find specific libraries for many other formats or write your own functions, but we won’t dig into those right now)
- Import various data sources into Python
- Write structured code to organize your data
- Tidy datasets and prepare them for analysis
Tidy data
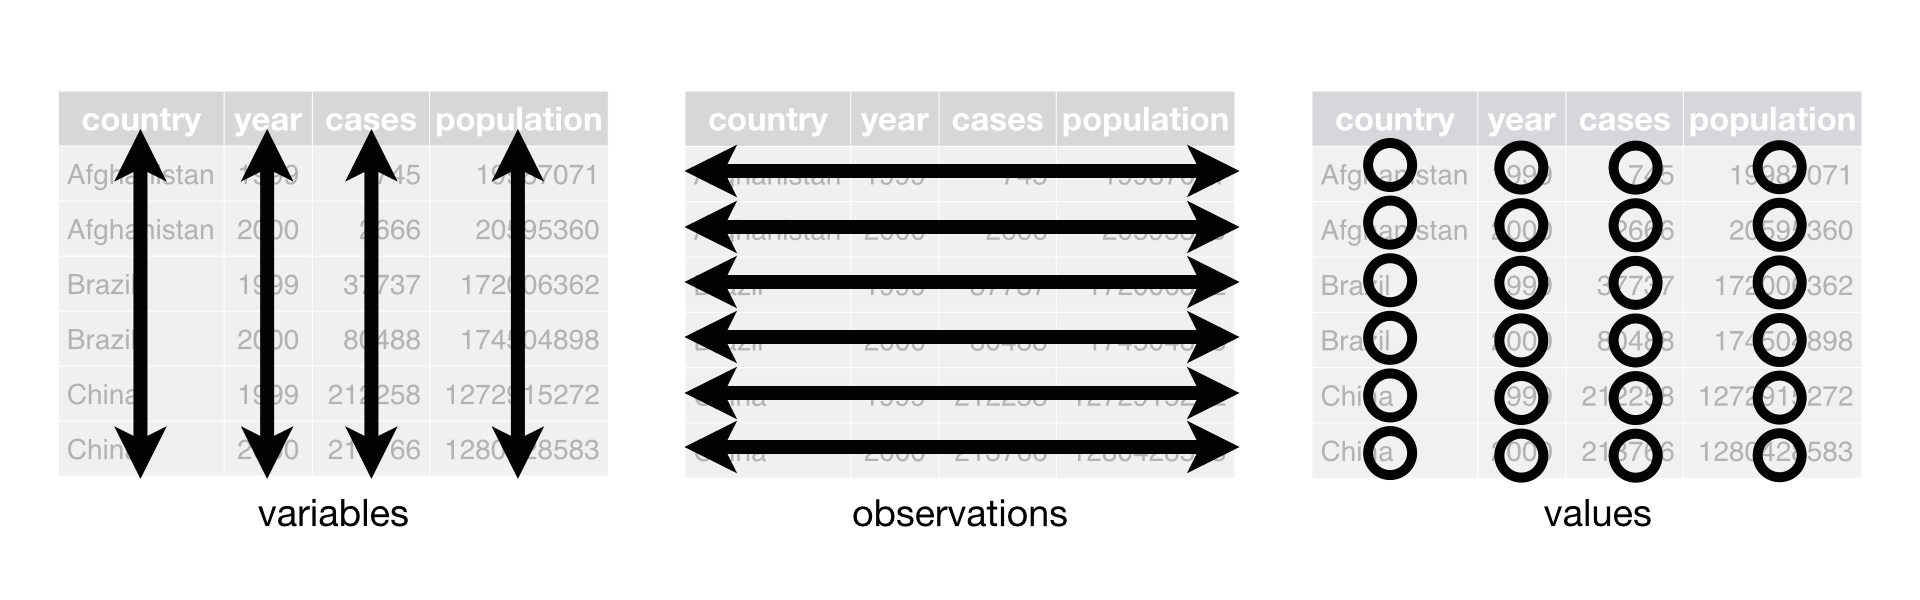
Within data science and this course we prefer to work with “Tidy” data. Tidy data is stored in such a way that it allows for easy and consistent analysis.There are three important rules to follow to make a dataset tidy:
- Each variable must have its own column.
- Each observation must have its own row.
- Each value must have its own cell
We store our data in pandas dataframes which are designed to be used with Tidy data. for these exercises it keep your pandas cheat sheet at hand https://pandas.pydata.org/Pandas_Cheat_Sheet.pdf
de Bilt Meteo
Last weeks we already looked at daily meteodata from the Bilt. Those tables were pre-processed fot quick loading and analysis. The data is made available bij the KNMI for download. Check out etmgeg_260.txt and what inforation is contained in the file. open the etmgeg in your favorite texteditor (eg. notepad or notepad++) and explore.
TipQuestion 1
How many rows of header are present? What information does the header provide.
TipQuestion 2
We are looking at precipitation, potential evapotranspirations, and temperature (the same as in the visualization exerciese). In which colums are those? What are the units of the stored data.
TipQuestion 3
What delimiter is used in this file?
Looking at the data table, values are preceded by spaces to give the text a neatly readable layout for people. We do not want to include the spaces in our dataframe as they may mess up analyses and proper detection of empty (nodata) cells. When reading the data into python we do not want to include the header in our tidy dataframe (skiprows=#), and als also set skipinitialspace=True to remove the extra spaces.
Code
our goal is to read in data directly from the source file and process it into a dataframe that is ideal for further processing and analysis. By creating a little script to read and prepare our data we can quickly and easily load new data (or maybe a different measurement station) when in becomes available, or make changes to the analyses by modifying the script and re-running it. Avoid opening data files in excel to remove some columns, change headers, or fix inconveniences at all cost. This removes tractability, and is very prone to errors (excel may wrongfully assume something is a date, shift time-zones, or you can on accident shift a row or column a bit rendering all the records invalid)
Now Use your variable explorer to quickly check if the file loaded properly. You can also use the pandas functions head, describe, and info to get some quick information about your dataframe.
TipQuestion 5
How many columns (Variables) of data are loaded, how many rows (Observations). Do any of the rows contain missing values (nodata or Null)?
TipQuestion 6
What is the datatype of the column ‘YYYYMMDD’
you can see that we have loaded lots of data that we do not actually need, and not all collumns names are completely clear at a glance. While the dataset has a tidy structure, we can make our life easier by selecting the colums we actually need and make sure the data is in the datatype and units that we need.
TipQuestion 7
Copy and complete the code below to make a a dataframe with date, daily mean temperature, potential evapotranspiration, and precipitation. for the dates we want to ure the a datetime type, the other columns are numerical (float64). Apply correction factors to convert the units to mm (for precipiation and evapotranspiration) and degrees Celsius (for temperature). (Bonus: why would the KNMI provide their data in the units they have chosen (0.1 mm) rather than in more common, or proper SI units)
data = pd.DataFrame({
     "date" : pd.to_datetime(rawdata['YYYYMMDD'], format='%Y%m%d'),
     "mean_daytemp_degC" : rawdata['TG'] * 0.1,
     "potential_evaporation_mm" :    ,

     } )
# sete the date field as index so we can use functions like .resample() that work on the index
data = data.set_index(data['date'], )
Note that very low values of precipitation are denoted with -1, we want to set those to 0 so these values do not interfere when summarizing or plotting the data.
# fix negative values in precip (-1 is used to indicate values < 0.5 instead of 0 in original dataset)

data.loc[data["precipitation_mm"] < 0.0, "precipitation_mm"] = 0.0
the earlier parts of the dataframe have lots of missing fields as we saw before. we therefore limit the datasets to the years between 1957 and 2023 to have full years of available data. with the dt.year function we can directly acceess the year information in our datetime information, and select only observations with value in our chosen range with .between
# the earlier parts of the dataframe have lots of missing fields, lets limit our dataset to 1957-2023
data = data.loc[data['date'].dt.year.between(1957,2023)]
TipQuestion 8
How many columns and observations does our data subset have? what are the mean and maximum values for both precipitation and temperature.